Save as PDF
Opens your browser print dialog — select "Save as PDF" to download.
IT-802 (A) (GS)
B.Tech., VIII Semester
Machine Learning
Note: i) Attempt any five questions.
किन्हीं पाँच प्रश्नों को हल कीजिए।
ii) All questions carry equal marks.
सभी प्रश्नों के समान अंक हैं।
iii) In case of any doubt or dispute the English version question should be treated as final.
किसी भी प्रकार के संदेह अथवा विवाद की स्थिति में अंग्रेजी भाषा के प्रश्न को अंतिम माना जायेगा।
Explain with the Examples of various Learning Paradigms, and the Finite and Infinite Hypothesis Spaces.
विभिन्न शिक्षण प्रतिमानों और परिमित और अनंत परिकल्पना रिक्तियों के उदाहरणों के साथ व्याख्या करें।
How will you define Posterior and prior probability in Naive bayes? For calculating performance of any classifier how the noise affect the performance give explanation using example.
आप Naive bayes में पश्च और पूर्व प्रायिकता को कैसे परिभाषित करेंगे? किसी भी क्लासिफायरियर के प्रदर्शन की गणना के लिए शोर प्रदर्शन को कैसे प्रभावित करता है उदाहरण का उपयोग करके स्पष्टीकरण दें।
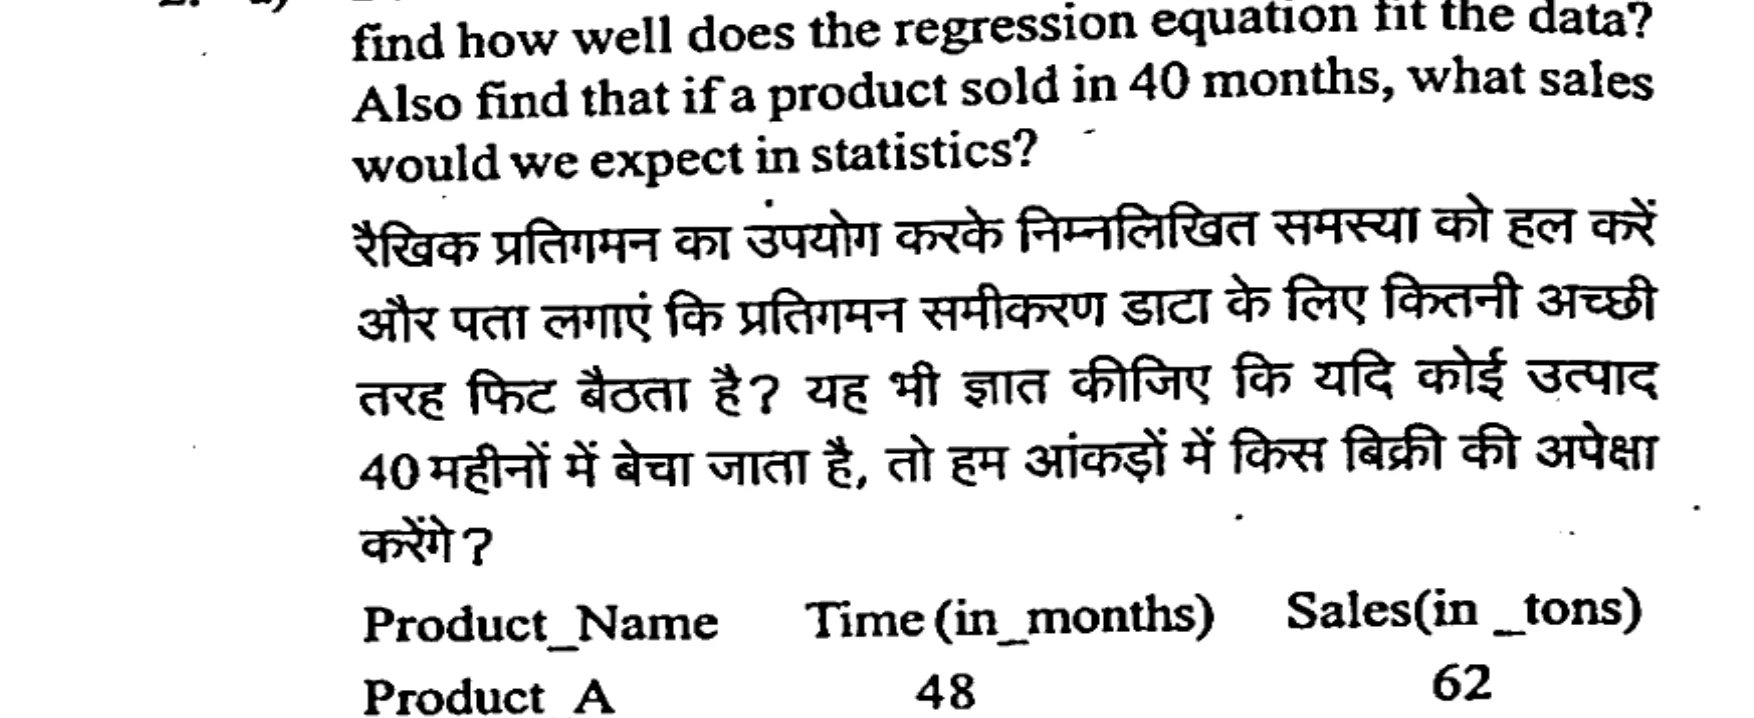
Solve the following problem using linear regression and find how well does the regression equation fit the data? Also find that if a product sold in 40 months, what sales would we expect in statistics?
शैक्षिक प्रतिगमन का उपयोग करके निम्नलिखित समस्या को हल करें और पता लगाएं कि प्रतिगमन समीकरण डेटा के लिए कितनी अच्छी तरह फिट बैठता है? यह भी ज्ञात कीजिए कि यदि कोई उत्पाद 40 महीनों में बेचा जाता है, तो इन आंकड़ों में किस बिक्री की अपेक्षा करेंगे?
Classify the linear separable data using support vector machine? Also find the support vectors and the maximum margin hyperplane. The coordinates of the data are: {(2, 1), (2, -1), (5, 1), (5, -1)} and {(1, 0), (0, 1), (-1, 0), (0, -1)}
सपोर्ट वेक्टर मशीन का उपयोग करके रैखिक वियोज्य डेटा को वर्गीकृत करें? समर्थन वैक्टर और अधिकतम मार्जिन हाइपरप्लेन भी खोजें डेटा के निर्देशांक हैं:
{(2, 1), (2, -1), (5, 1), (5, -1)} and {(1, 0), (0, 1), (-1, 0), (0, -1)}
Explain Bayesian Learning in probabilistic learning. Give suitable example.
संभाव्य अधिगम में बायसियन अधिगम की व्याख्या कीजिए। उपयुक्त उदाहरण दीजिए।
Suppose that the data mining task is to cluster the following eight points (with (x,y) representing location) into three clusters.
मान लीजिए कि डेटा माइनिंग कार्य निम्नलिखित आठ बिंदुओं (x,y) स्थान का प्रतिनिधित्व करने वाले को तीन समूहों में क्लस्टर करना है:
A1(2, 10), A2(2, 5), A3(8, 4), B1(5, 8), B2(7, 5), B3(6, 4), C1(1, 2), C2(4, 9).
The distance function is Euclidean distance. Suppose initially we assign A1, B1, and C1 as the center of each cluster, respectively. Use the k-means algorithm to show only:
दूरी फलन यूक्लिडियन दूरी है। मान लीजिए कि शुरू में हम क्रमशः A1, B1, और C1 को प्रत्येक क्लस्टर के केंद्र के रूप में निर्दिष्ट करते हैं। केवल दिखाने के लिए k-साधन एल्गोरिथम का उपयोग करें।
i) The three cluster centers after the first round execution
i) पहले दौर के निष्पादन के बाद तीन क्लस्टर केंद्र
ii) The final three clusters
ii) अंतिम तीन क्लस्टर
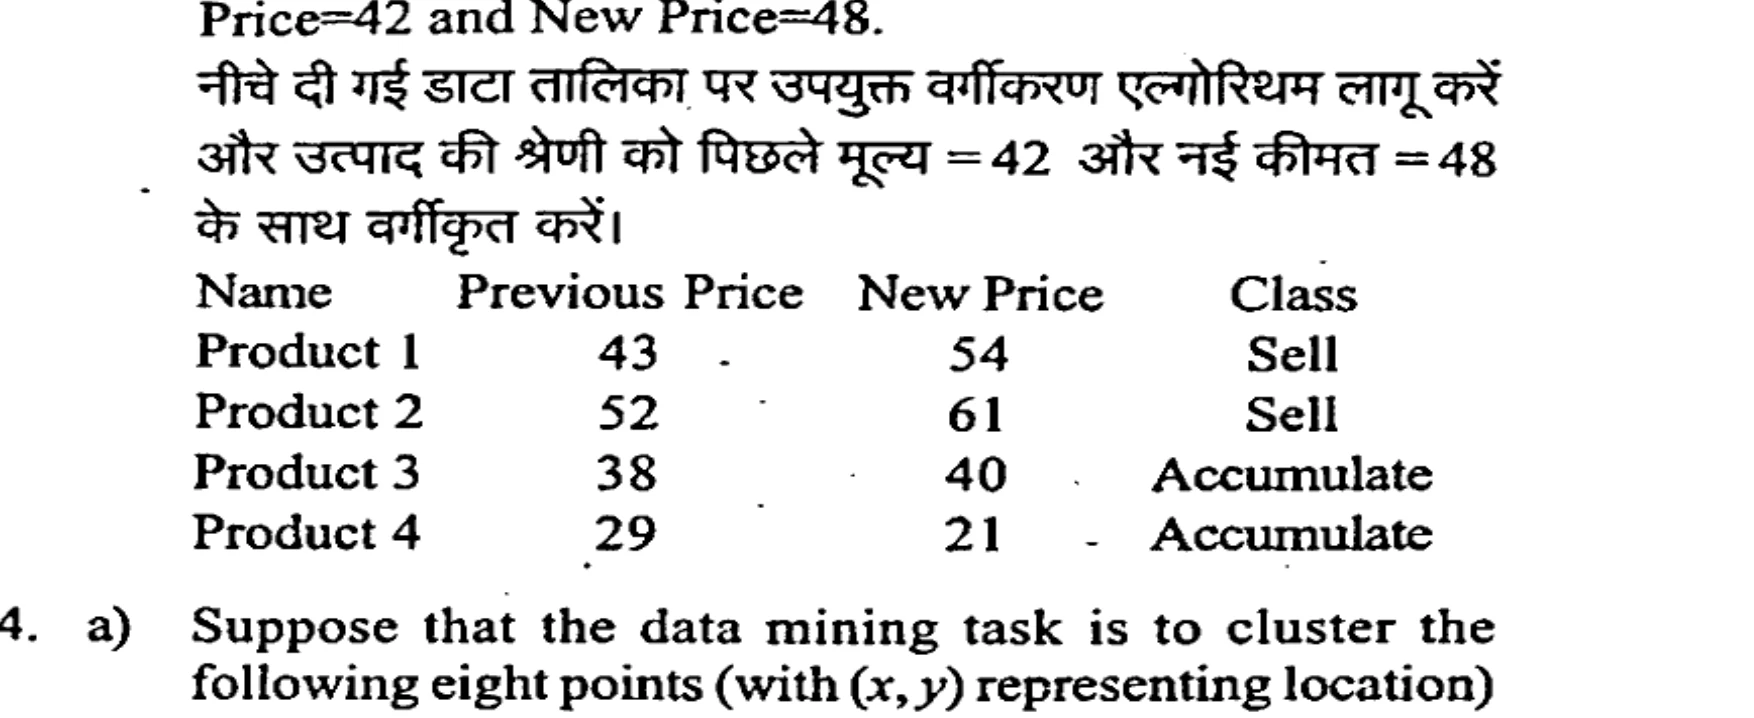
Apply appropriate classification algorithm on below data table and classify the class of product with Previous Price=42 and New Price=48.
नीचे दी गई डेटा तालिका पर उपयुक्त वर्गीकरण एल्गोरिथम लागू करें और उत्पाद की श्रेणी को पिछले मूल्य = 42 और नई कीमत = 48 के साथ वर्गीकृत करें।
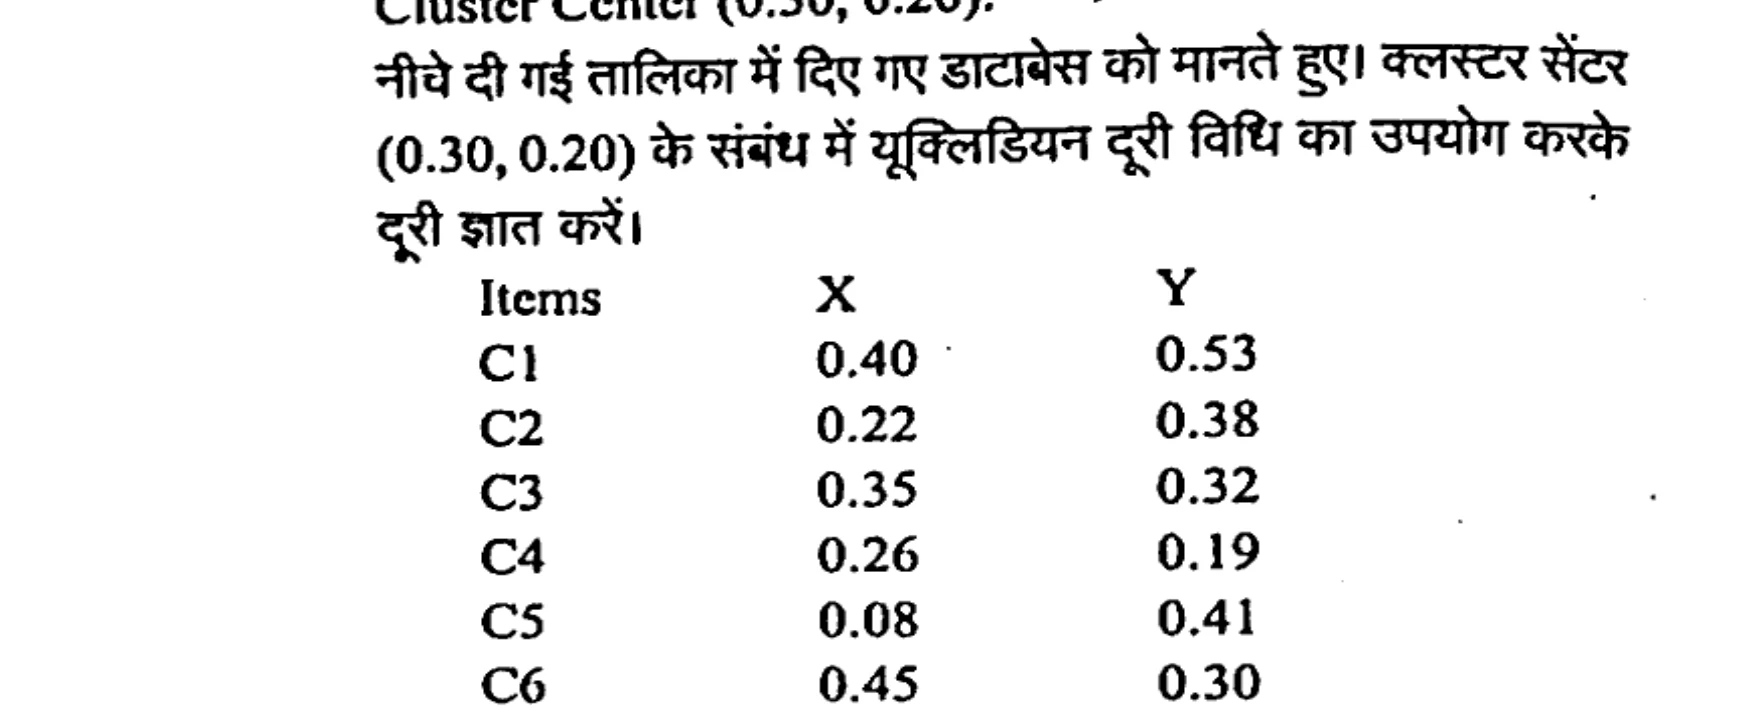
Assuming the database given in the table below. Find the distance using Euclidean distance method with respect to Cluster Center (0.30, 0.20).
नीचे दी गई तालिका में दिए गए डेटाबेस ��ो मानते हुए। क्लस्टर सेंटर (0.30, 0.20) के संबंध में यूक्लिडियन दूरी विधि का उपयोग करके दूरी ज्ञात करें।
Explain Linear and Logistic regression. What are the advantages for the same?
लीनियर और लॉजिस्टिक रिग्रेशन को समझाइए। उसी के लिए क्या फायदे हैं?
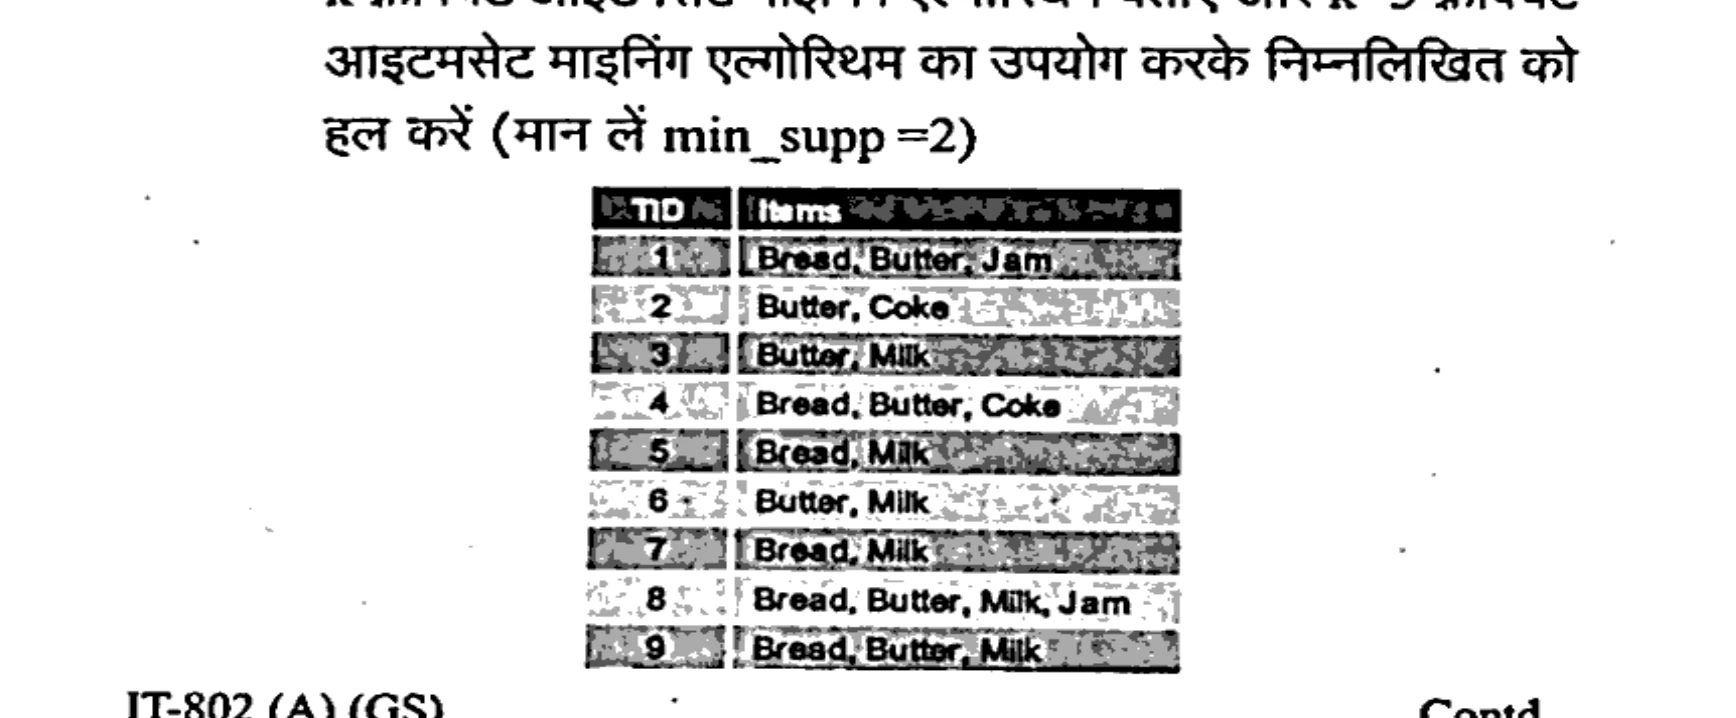
State the k frequent itemset mining Algorithm and Solve the following problem using k=3 frequent itemset mining Algorithm (assume min_supp =2):
k फ्रीक्वेंट आइटमसेट माइनिंग एल्गोरिथम बताएं और k=3 फ्रीक्वेंट आइटमसेट माइनिंग एल्गोरिथम का उपयोग करके निम्नलिखित को हल करें (मान लें min_supp =2):
Explain and elaborate Self-Organizing Map. Justify your answer with neat diagram and example.
स्व-संगठन मानचित्र की व्याख्या और विस्तृत करें। अपने उत्तर की पुष्टि स्वच्छ चित्र और उदाहरण द्वारा कीजिए।
What is Principal Component Analysis (PCA)? Explain using an example. Also explain the concept of Dimensionality reduction.
प्रिंसिपल कंपोनेंट एनालिसिस (PCA) क्या है? एक उदाहरण की सहायता से समझाएं। विमीयता में कमी की अवधारणा को भी समझाएं।
What do you understand by Hierarchical clustering? Also explain AGNES, DIANA.
श्रेणीबद्ध क्लस्टरिंग से आप क्या समझते हैं? एग्नेस, डायना को सभी समझाएं।
What is the objective of convergence of cost function? Can we use it for the linear regression and how it's related to SSE? Justify your answer with proper explanation.
लागत फ़लन के अभिसरण का उद्देश्य क्या है? क्या हम इसका उपयोग रैखिक प्रतिगमन के लिए कर सकते हैं और यह SSE से कैसे संबंधित है? उचित स्पष्टीकरण के साथ अपने उत्तर की पुष्टि कीजिए।
(Suppose after invention of Covid'19 drug) for conducting A Covid'19 drug test for (random variable T) has 1% false positives (i.e., 1% of those not taking drugs show positive in the test), and 5% false negatives (i.e., 5% of those taking drugs test negative). Suppose that 2% of those Covid'19 tested are taking drugs. Determine the probability that somebody who tests positive is actually taking drugs (random variable D).
(मान लीजिए कि Covid'19 दवा के आविष्कार के बाद) Covid'19 इन टेस्ट आयोजित करने के लिए (यादृच्छिक चर T के लिए) में 1% झूठी सकारात्मकता है (यानी, ड्रग्स नहीं लेने वालों में से 1% परीक्षण में सकारात्मक दिखाते हैं) और 5% गलत नकारात्मक (अर्थात, दवा लेने वालों में से 5% नकारात्मक परीक्षण करते हैं)। मान लीजिए कि परीक्षण किए गए Covid'19 में से 2% ड्रग्स ले रहे हैं। इस संभावना का निर्धारण करें कि सकारात्मक परीक्षण करने वाले कोई व्यक्ति वास्तव में ड्रग्स ले रहा है (यादृच्छिक चर D)।
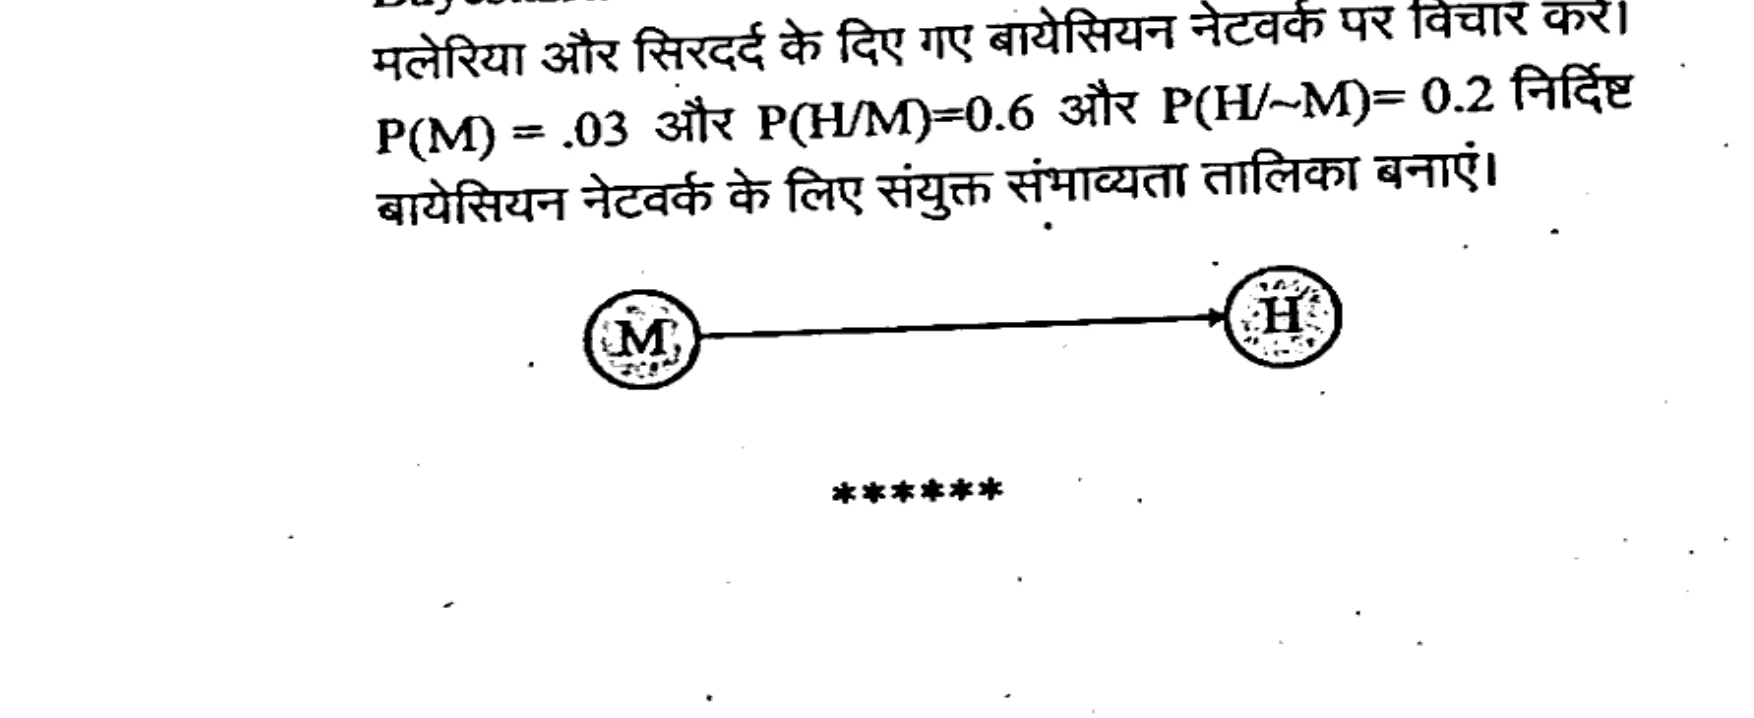
Consider the given Bayesian network of malaria and headache. P(M)= .03, and P(H|M)=0.6, and P(H|~M)=0.2. Create the joint probability table for the specified Bayesian network.
मलेरिया और सिरदर्द के दिए गए बायसियन नेटवर्क पर विचार करें। P(M)= .03 और P(H|M)=0.6 और P(H|~M)=0.2 निर्दिष्ट बायसियन नेटवर्क के लिए संयुक्त संभाव्यता तालिका बनाएं।