Save as PDF
Opens your browser print dialog — select "Save as PDF" to download.
B.Tech., (Computer Science and Business System)
II Semester
Examination, June 2024
Grading System (GS)
Statistical Method
Note: i) Answer any five questions. (किन्हीं पाँच प्रश्नों को हल कीजिए।)
ii) All questions carry equal marks. (सभी प्रश्नों के समान अंक हैं।)
iii) In case of any doubt or dispute the English version question should be treated as final. (किसी भी प्रकार के संदेह अथवा विवाद की स्थिति में अंग्रेजी भाषा के प्रश्न को अंतिम माना जायेगा।)
Calculate Karl Pearson’s coefficient of correlation from the following data and interpret its value :
निम्नलिखित डेटा से कार्ल पियर्सन के सहसंबंध गुणांक की गणना करें और इसके मूल्य की व्याख्या करें।
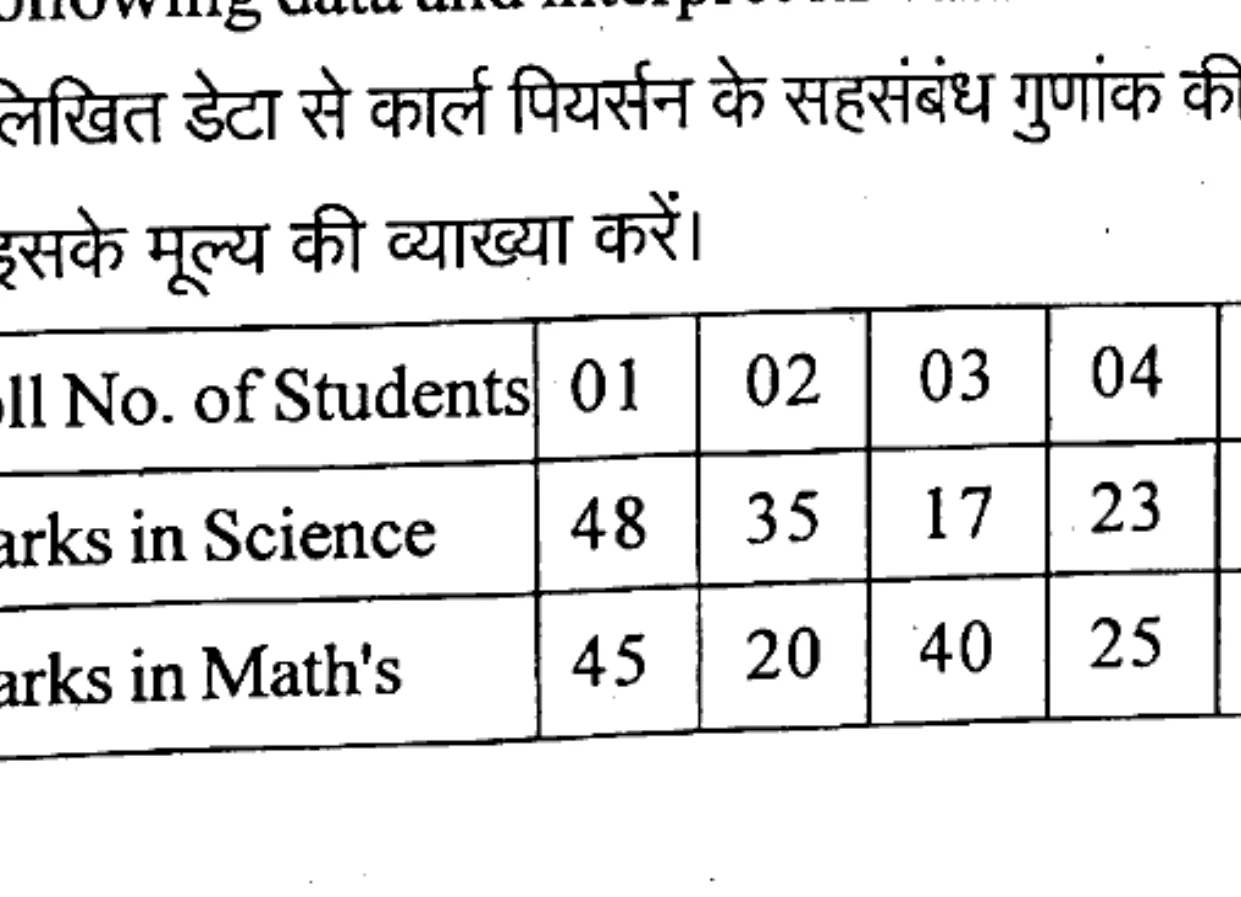
| Roll No. of Students | 01 | 02 | 03 | 04 | 05 |
|---|---|---|---|---|---|
| Marks in Science | 48 | 35 | 17 | 23 | 47 |
| Marks in Math's | 45 | 20 | 40 | 25 | 45 |
Coefficient of correlation between X and Y for 20 items is 0.3; mean of X is 15 and that Y is 20, standard deviations are 4 and 5 respectively. At the time of calculation one item 27 has wrongly taken as 17 in case of X series and 35 instead of 30 in case of Y series. Find the correct coefficient of correlation.
20 वस्तुओं के लिए X और Y के बीच सहसंबंध का गुणांक 0.3 है; X का माध्य 15 है और Y का माध्य 20 है, मानक विचलन क्रमशः 4 और 5 हैं। गणना के समय एक आइटम 27 को गलती से X सीरीज के मामले में 17 और Y सीरीज के मामले में 30 के बजाय 35 मान लिया गया है। सहसंबंध का सही गुणांक ज्ञात कीजिए।
The following table shows the ages (X) and blood pressure (Y) of 8 persons. Obtain the regression equation of Y on X and find the expected blood pressure of a person who is 49 years old.
निम्न तालिका 8 व्यक्तियों की आयु (X) और रक्तचाप (Y) दर्शाती है। X पर Y का प्रतिगमन समीकरण प्राप्त करें और 49 वर्ष के व्यक्ति का अपेक्षित रक्तचाप ज्ञात करें।
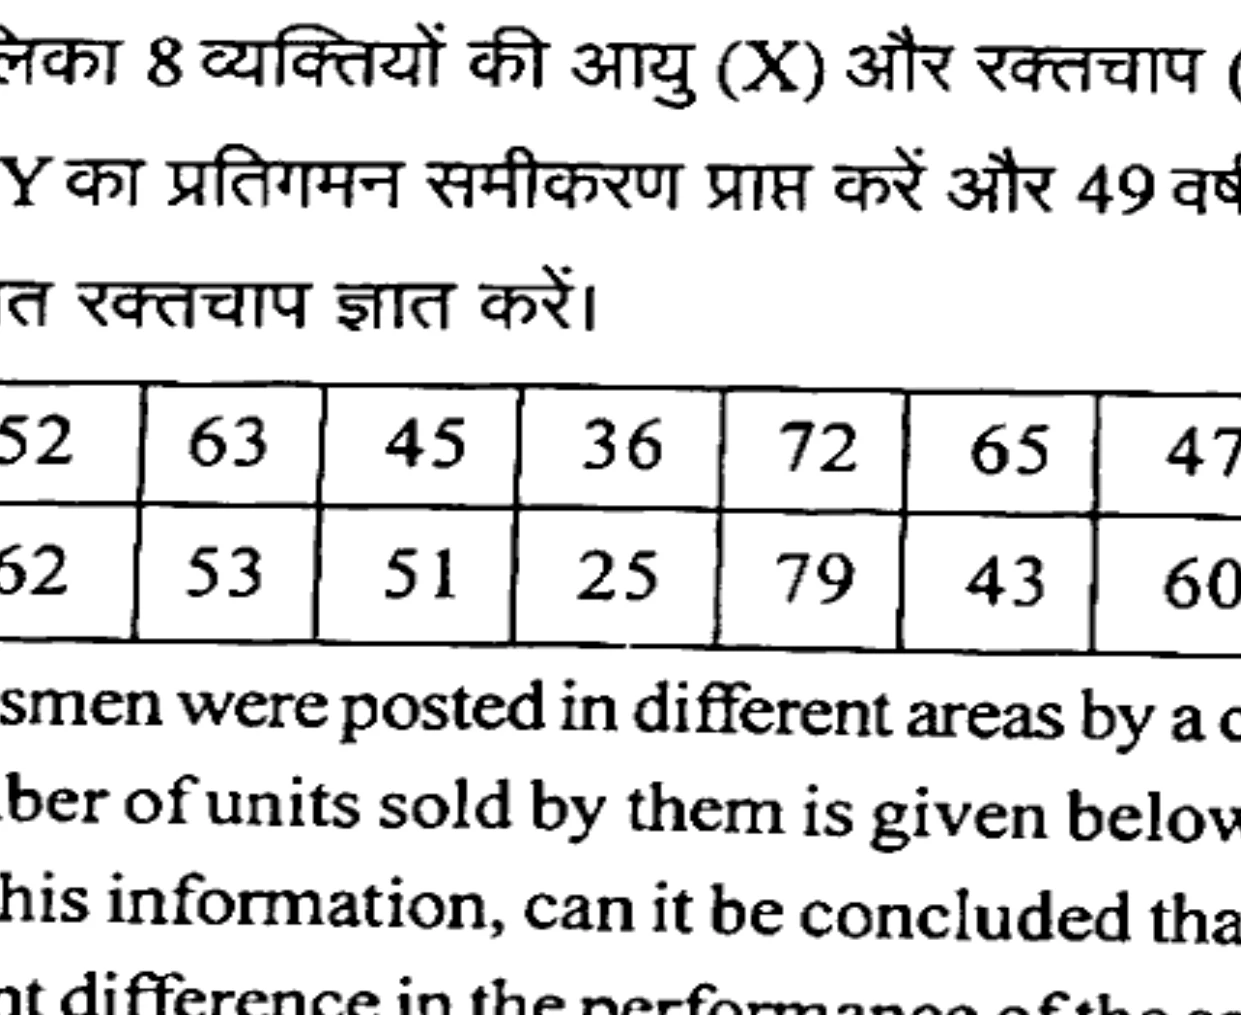
| X | 52 | 63 | 45 | 36 | 72 | 65 | 47 | 25 |
|---|---|---|---|---|---|---|---|---|
| Y | 62 | 53 | 51 | 25 | 79 | 43 | 60 | 33 |
Four salesmen were posted in different areas by a company. The number of units sold by them is given below: On the basis of this information, can it be concluded that there is significant difference in the performance of the salesmen?
���क कंपनी द्वारा चार सेल्समैन को अलग-अलग क्षेत्रों में तैनात किया गया था। उनके द्वारा बेची गई इकाइयों की संख्या नीचे दी गई है: इस जानकारी के आधार पर, क्या यह निष्कर्ष निकाला जा सकता है कि सेल्समैन के प्रदर्शन में महत्वपूर्ण अंतर है?
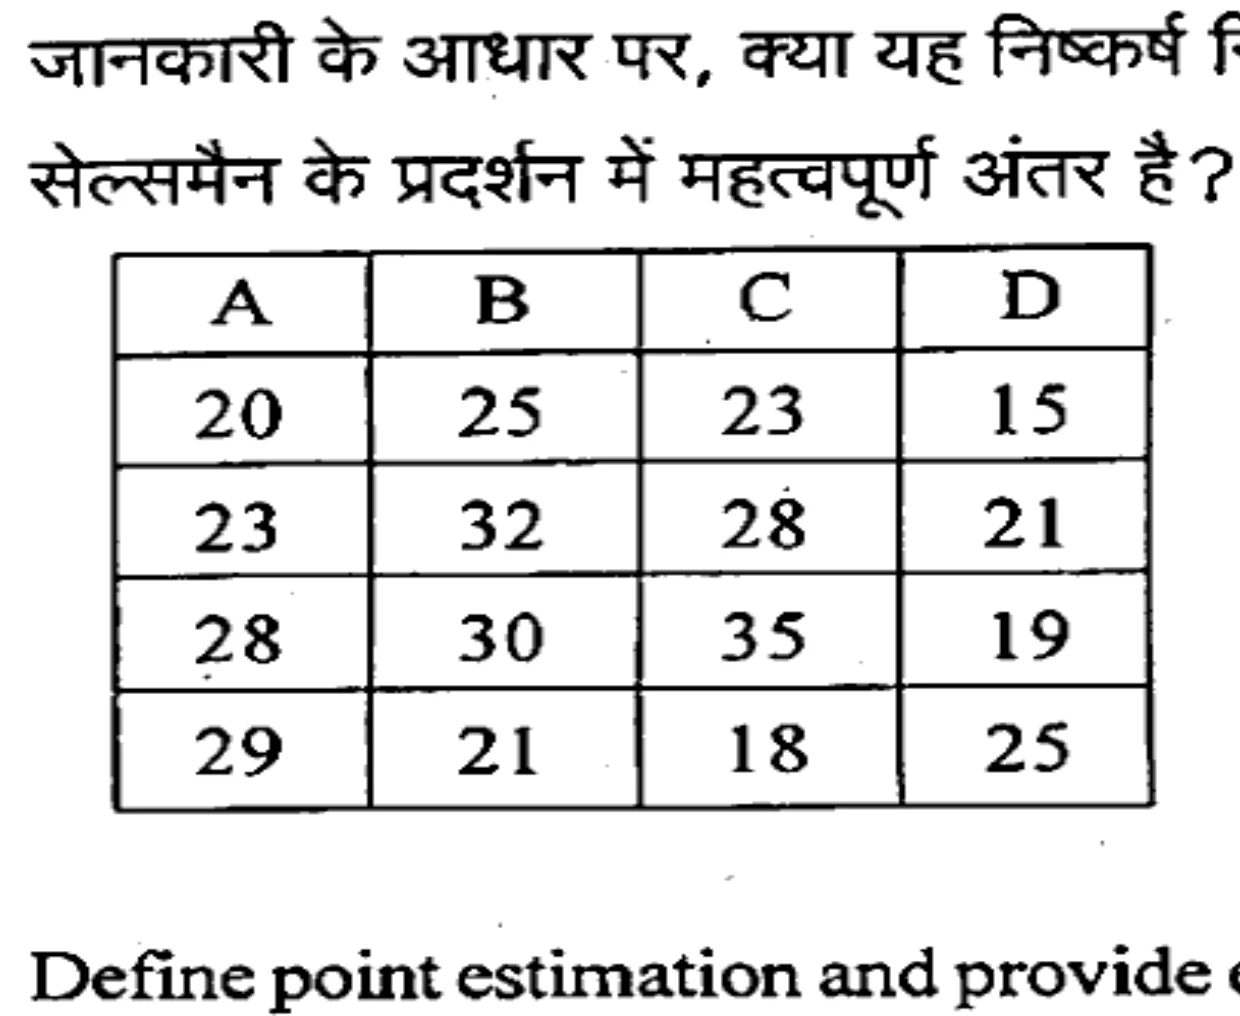
| A | B | C | D |
|---|---|---|---|
| 20 | 25 | 23 | 15 |
| 23 | 32 | 28 | 21 |
| 28 | 30 | 35 | 19 |
| 29 | 21 | 18 | 25 |
Define point estimation and provide examples to illustrate its application in statistical analysis.
बिंदु अनुमान को परिभाषित करें और सांख्यिकीय विश्लेषण में इसके अनुप्रयोग को स्पष्ट करने के लिए उदाहरण प्रदान करें।
A manufacturing company implements a new process claiming it is more efficient in producing defect-free products. If the statistical analysis fails to reject the null hypothesis that the new process is not superior to the previous one, but in reality, the new process is far more efficient, what type of error has the company committed?
एक निर्माण कंपनी एक नई प्रक्रिया लागू करती है और दावा करती है कि ���ह दोष-मुक्त उत्पाद बनाने में अधिक कुशल है। यदि सांख्यिकीय विश्लेषण शून्य परिकल्पना को अस्वीकार करने में विफल रहता है कि नई प्रक्रिया पिछली प्रक्रिया से बेहतर नहीं है, लेकिन वास्तव में, नई प्रक्रिया कहीं अधिक कुशल है, तो कंपनी ने किस प्रकार की त्रुटि की है?
In order to investigate whether adults report verbally presented material more accurately from their right ear than from their left ear, a dichotic listening task was carried out. The data were found to be positively skewed. Number of words reported:
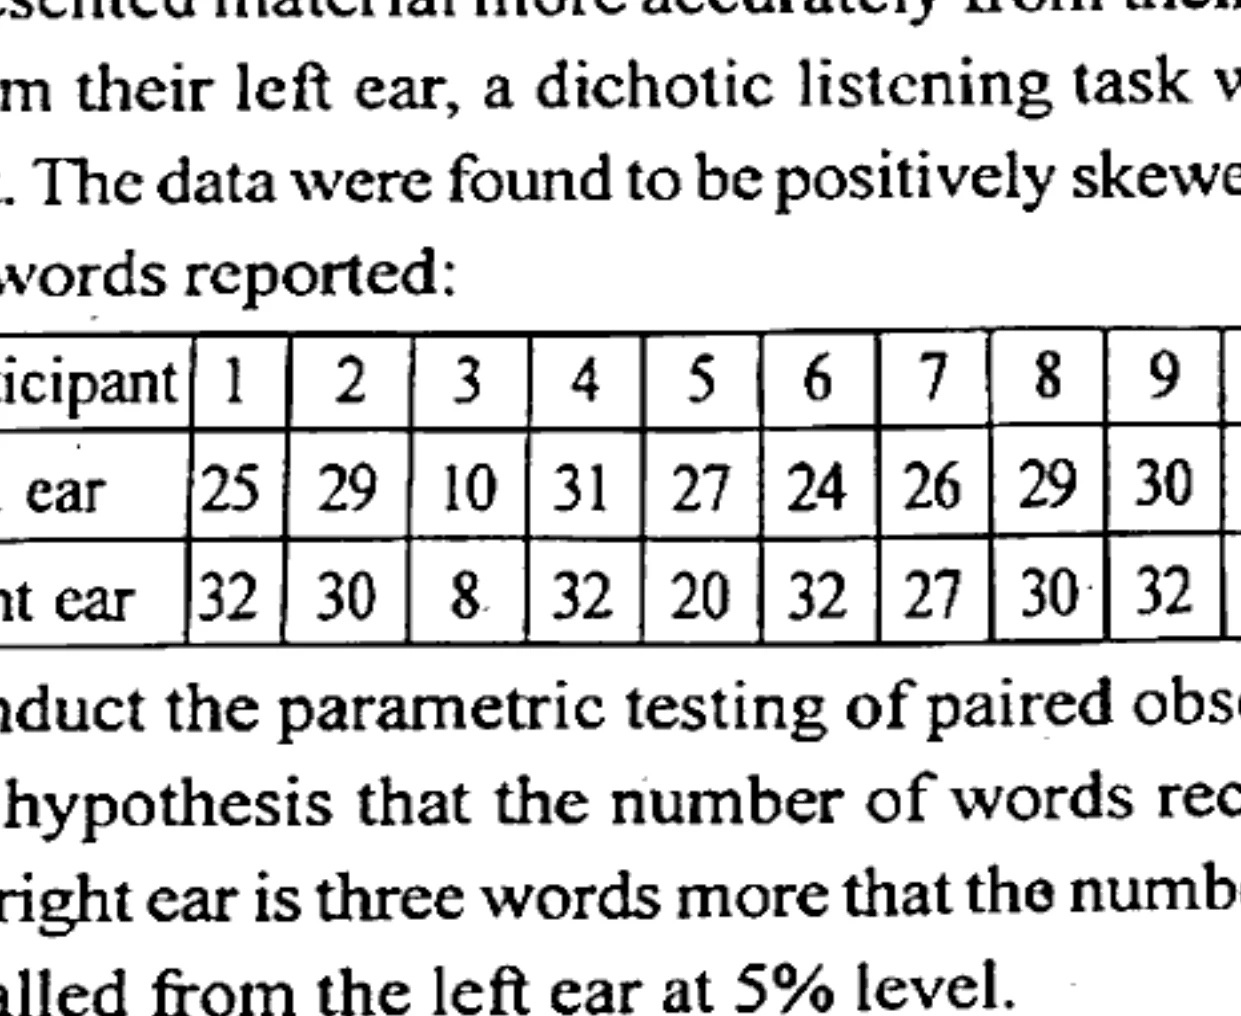
| Participant | 1 | 2 | 3 | 4 | 5 | 6 | 7 | 8 | 9 | 10 | 11 | 12 |
|---|---|---|---|---|---|---|---|---|---|---|---|---|
| Left ear | 25 | 29 | 10 | 31 | 27 | 24 | 26 | 29 | 30 | 32 | 20 | 5 |
| Right ear | 32 | 30 | 8 | 32 | 20 | 32 | 27 | 30 | 32 | 32 | 30 | 32 |
Conduct the parametric testing of paired observation of the hypothesis that the number of words recalled from the right ear is three words more that the number of words recalled from the left ear at 5% level.
यह जाँचने के लिए कि क्या वयस्क मौखिक रूप से प्रस्तुत सामग्री को अपने बाएँ कान की तुलना में अपने दाएँ से अधिक सटीक रूप से रिपोर्ट करते हैं, एक द्विभाषी श्रवण कार्य किया गया था। डेटा सकारात्मक रूप से विषम था। रिपोर्ट किए गए शब्दों की संख्या:
इस परिकल्पना के युग्मित अवलोकन का पैरामीट्रिक परीक्षण करें कि दाएँ कान से याद किए गए शब्दों की संख्या बाएँ कान से याद किए गए शब्दों की संख्या 5% के स्तर पर तीन शब्द अधिक है।
Evaluate the importance of setting appropriate significance levels in hypothesis testing.
परिकल्पना परीक्षण में उचित महत्व स्तर निर्धारित करने के महत्व का मूल्यांकन करें।
Evaluate the Kolmogorov-Smirnov test as a non-parametric method for comparing distributions.
वितरण की तुलना के लिए एक गैर-पैरामीट्रिक विधि के रूप में कोल्मोगोरोव-स्मिरनोव परीक्षण का मूल्यांकन करें।
Fit a straight line trend to the following time series data: Estimate trend from the series. What components are left over?
निम्नलिखित समय श्रृंखला डेटा के लिए एक सीधी रेखा प्रवृत्ति को फिट करें: श्रृंखला से रुझान का अनुमान लगाएं। कौन से घटक बचे हैं?
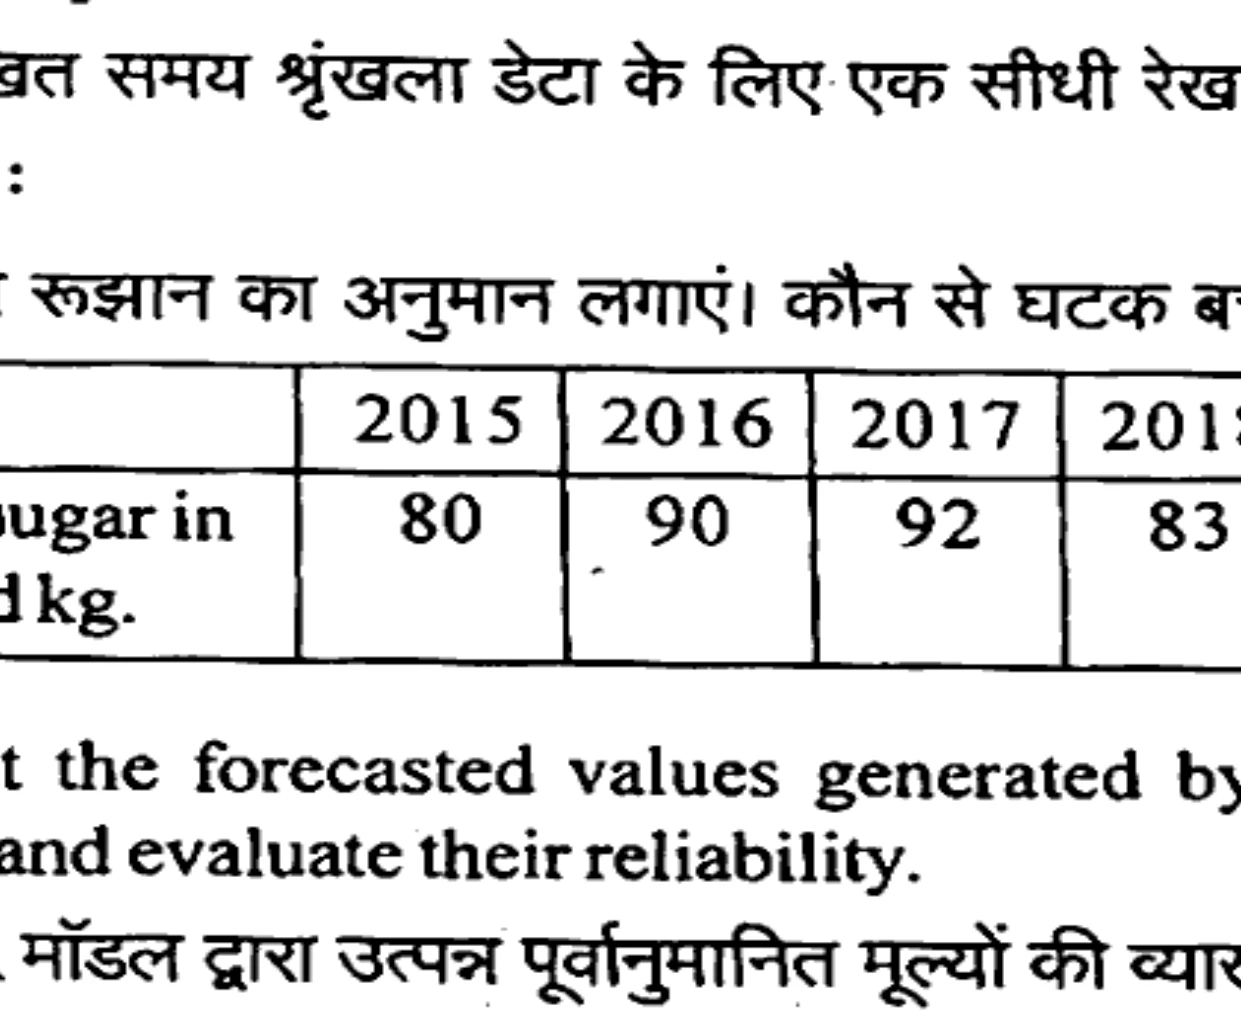
| Year | 2015 | 2016 | 2017 | 2018 | 2019 |
|---|---|---|---|---|---|
| Sale of sugar in thousand kg. | 80 | 90 | 92 | 83 | 94 |
Interpret the forecasted values generated by ARIMA models and evaluate their reliability.
ARIMA मॉडल द्वारा उत्पन्न पूर्वानुमानित मूल्यों की व्याख्या करें और उनकी विश्वसनीयता का मूल्यांकन करें।
How does Kendall rank correlation differ from Pearson’s correlation?
कैंडल रैंक सहसंबंध पियर्सन के सहसंबंध स��� किस प्रकार भिन्न है?
Explain the process of reading in data from a CSV file in R and outline the main steps involved.
R में CSV फाइल से डेटा पढ़ने की प्रक्रिया की व्याख्या करें और इसमें शामिल मुख्य चरणों की रूपरेखा तैयार करें।
Describe the purpose of simulation in statistical assessment?
सांख्यिकीय मूल्यांकन में अनुकरण के उद्देश्य का वर्णन करें?
Write short notes on any two of the following.
निम्नलिखित में से किन्हीं दो पर संक्षिप्त टिप्पणी लिखिए।
- 'R' Functions ('R' कार्य)
- Tolerance region (सहनशीलता क्षेत्र)
- Neyman-Pearson method of statistics (सांख्यिकी की नेमन-पियर्सन विधि)
- Time series forecasting models (समय श्रृंखला पूर्वानुमान मॉडल)