Save as PDF
Opens your browser print dialog — select "Save as PDF" to download.
Total No. of Questions : 8
Total No. of Printed Pages : 4
[2]
Roll No ..................................... 7
AI/AL/CD-302 (GS)
B.Tech., III Semester
Examination, June 2024
Grading System (GS)
Introduction to Probability and Statistics
Time : Three Hours
Maximum Marks : 70
Note:
i) Answer any five questions.
किन्हीं पाँच प्रश्नों को हल कीजिए।
ii) All questions carry equal marks.
सभी प्रश्नों के समान अंक हैं।
iii) In case of any doubt or dispute the English version question should be treated as final.
किसी भी प्रकार के संदेह अथवा विवाद की स्थिति में अंग्रेजी भाषा के प्रश्न को अंतिम माना जायेगा।।
1. a)
Define discrete random variables. IF X and Y are any two random variables, then show that E(X+Y) = E(X) + E(Y) Provided E(X) and E(Y) exist.
7
असतत यादृच्छिक चर को परिभाषित करें। यदि X और Y कोई दो यादृच्छिक चर हैं, तो दिखाएँ कि E(X+Y) = E(X) + E(Y) बशर्ते E(X) और E(Y) मौजूद हों।
b)
If X is a continuous random variable and Y= aX + b. Prove that E(Y) = aE(X) + b and V(Y) = a². V(X), where V stands for variance and a, b are constants.
7
यदि X एक सतत यादृच्छिक चर है और Y= aX + b है। साबित करें कि E(Y) = aE(X) + b और V(Y) = a². V(X) जहाँ V का मतलब विचरण है और a, b स्थिरांक हैं।
2. a)
A sample of 4 items is selected at random from a box containing 12 items of which 5 are defective. Find the expected number E of defective items.
7
12 वस्तुओं वाले एक बॉक्स से यादृच्छिक रूप से 4 वस्तुओं का एक नमूना चुना जाता है, जिनमें से 5 दोषपूर्ण हैं। दोषपूर्ण वस्तुओं की अपेक्षित संख्या E ज्ञात कीजिये।
b)
Let f(x) be the probability density function of a continuous random variable X. Then explain Mean, Median, Mode, variance and mean deviation.
7
मान लीजिए f(x) एक सतत यादृच्छिक चर X का संभाव्यता घनत्व फलन है। फिर माध्य, माध्यिका, बहुलक, प्रसरण और माध्य विचलन की व्याख्या करें।
3.
The probability density f(x) of a continuous random variable is given by f(x) = Ce-|x|, -∞ < x < ∞. Show that C = ½ and find the mean and variance of the distribution. Also find the probability that the variate lies between 0 and 4.
14
एक सतत यादृच्छिक चर का संभाव्यता घनत्व f(x) = Ce-|x|, -∞ < x < ∞ द्वारा दिया जाता है। दिखाएँ कि C = ½ और वितरण का माध्य और प्रसरण ज्ञात कीजिए। यह प्रायिकता भी ज्ञात कीजिए कि चर 0 और 4 के बीच है।
4.
State and prove Bayes theorem. Suppose 5 men out of 100 and 25 women out of 10,000 are color blind. A color blind person is chosen at random. What is the probability of the person being a male. (Assuming male and female to be in equal numbers).
14
बेयस प्रमेय बताइए और सिद्ध करें। मान लीजिए कि 100 में से 5 पुरुष और 10,000 में से 25 महिलाएँ कलर ब्लाइंड हैं। एक रंग-अंधे व्यक्ति को यादृच्छिक रूप से चुना जाता है। उस व्यक्ति के पुरुष होने की प्रायिकता क्या है? (पुरुष और महिला को समान संख्या में मानते हुए)
[3]
[4]
5. a)
The first four central moments of a distribution are 0, 2.5, 0.7 and 1.75. Calculate β₁, β₂.
7
वितरण के पहले चार केंद्रीय क्षण 0, 2.5, 0.7 और 1.75 हैं। β₁, β₂ की गणना करें।
b)
The mean and variance of a binomial variable X with parameters n and p are 16 and 8. Find :
7
P(X ≥ 1) and P(X > 2).
पैरामीटर n और p के साथ एक द्विपद चर X का माध्य और प्रसरण 16 और 8 हैं। P(X ≥ 1) और P(X > 2) खोजें।
6. a)
If X is normally distributed with mean 2 and variance 0.1, then find P( |x − 2| ≥ 0.01).
7
यदि X को सामान्यतः माध्य 2 और प्रसरण 0.1 के साथ वितरित किया जाता है, तो P( |x − 2| ≥ 0.01) ज्ञात करें।
b)
Explain comparison between Correlation and Regression.
7
सहसंबंध और प्रतिगमन के बीच तुलना स्पष्ट करें।
7. a)
Fit a parabola for the following data.
7
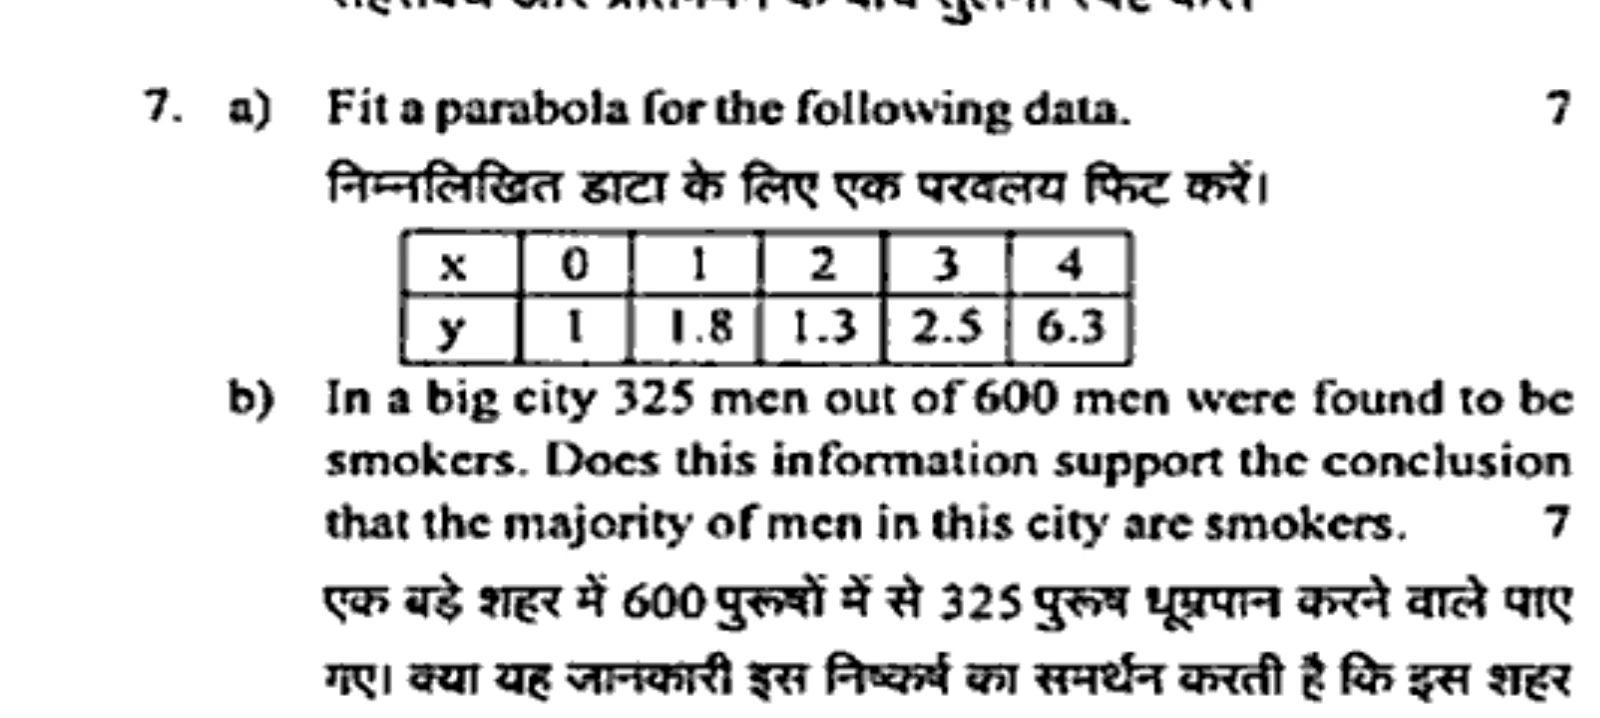
निम्नलिखित डाटा के लिए एक परवलय फिट करें।
b)
In a big city 325 men out of 600 men were found to be smokers. Does this information support the conclusion that the majority of men in this city are smokers.
7
एक बड़े शहर में 600 पुरुषों में से 325 पुरुष धूम्रपान करते वाले पाए गए। क्या यह जानकारी इस निष्कर्ष का समर्थन करती है कि इस शहर में अधिकांश पुरुष धूम्रपान करते हैं।
8. a)
The table below give the number of air craft accidents that occurred during the various days of the week. Test whether the accidents are uniformly distributed over the week.
7
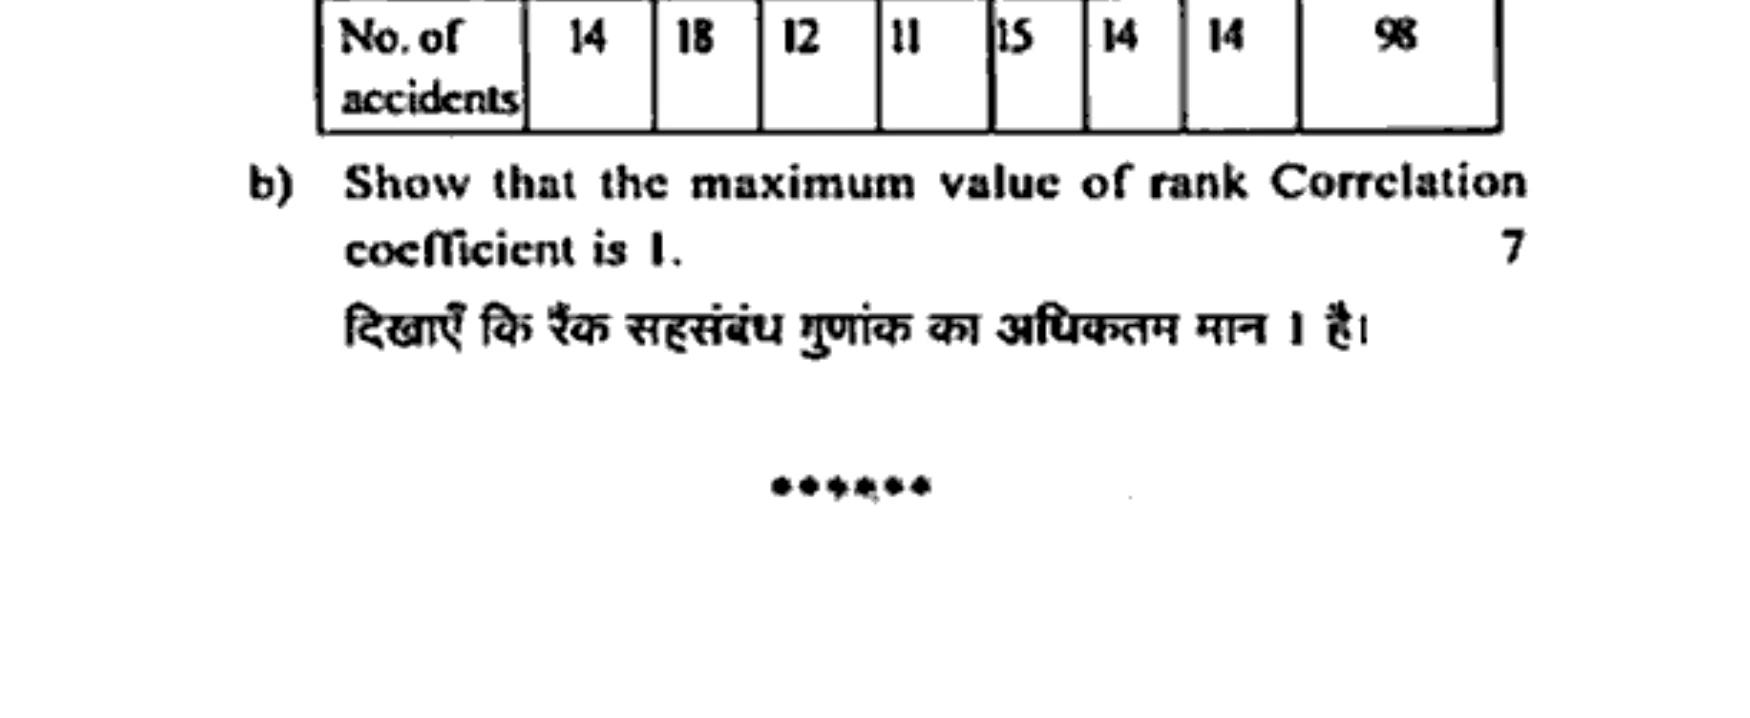
नीचे दी गई तालिक सप्ताह के विभिन्न दिनों में हुई विमान दुर्घटनाओं की संख्या बताती है। परीक्षण करें कि क्या दुर्घटनाएँ सप्ताह भर में समान रूप से वितरित हैं।
b)
Show that the maximum value of rank Correlation coefficient is 1.
7
दिखाएँ कि रैंक सहसंबंध गुणांक का अधिकतम मान 1 है।