Save as PDF
Opens your browser print dialog — select "Save as PDF" to download.
Total No. of Questions : 8
[2]
Total No. of Printed Pages : 4
Enrollment No.
AI/AL/CD302(GS)
B. Tech. III Semester
Examination, December 2025
Grading System (GS)
Introduction to Probability and Statistics
Time : Three Hours
Maximum Marks : 70
Note :
-
(i) Attempt any five questions.
किन्हीं पाँच प्रश्नों को हल कीजिए।
-
(ii) All questions carry equal marks.
सभी प्रश्नों के समा�� अंक हैं।
-
(iii) In case of any doubt or dispute the English version question should be treated as final.
किसी भी प्रकार के संदेह अथवा विवाद की स्थिति में अंग्रेजी भाषा के प्रश्न को अंतिम माना जायेगा।
(a) A random variable X has the following probability function
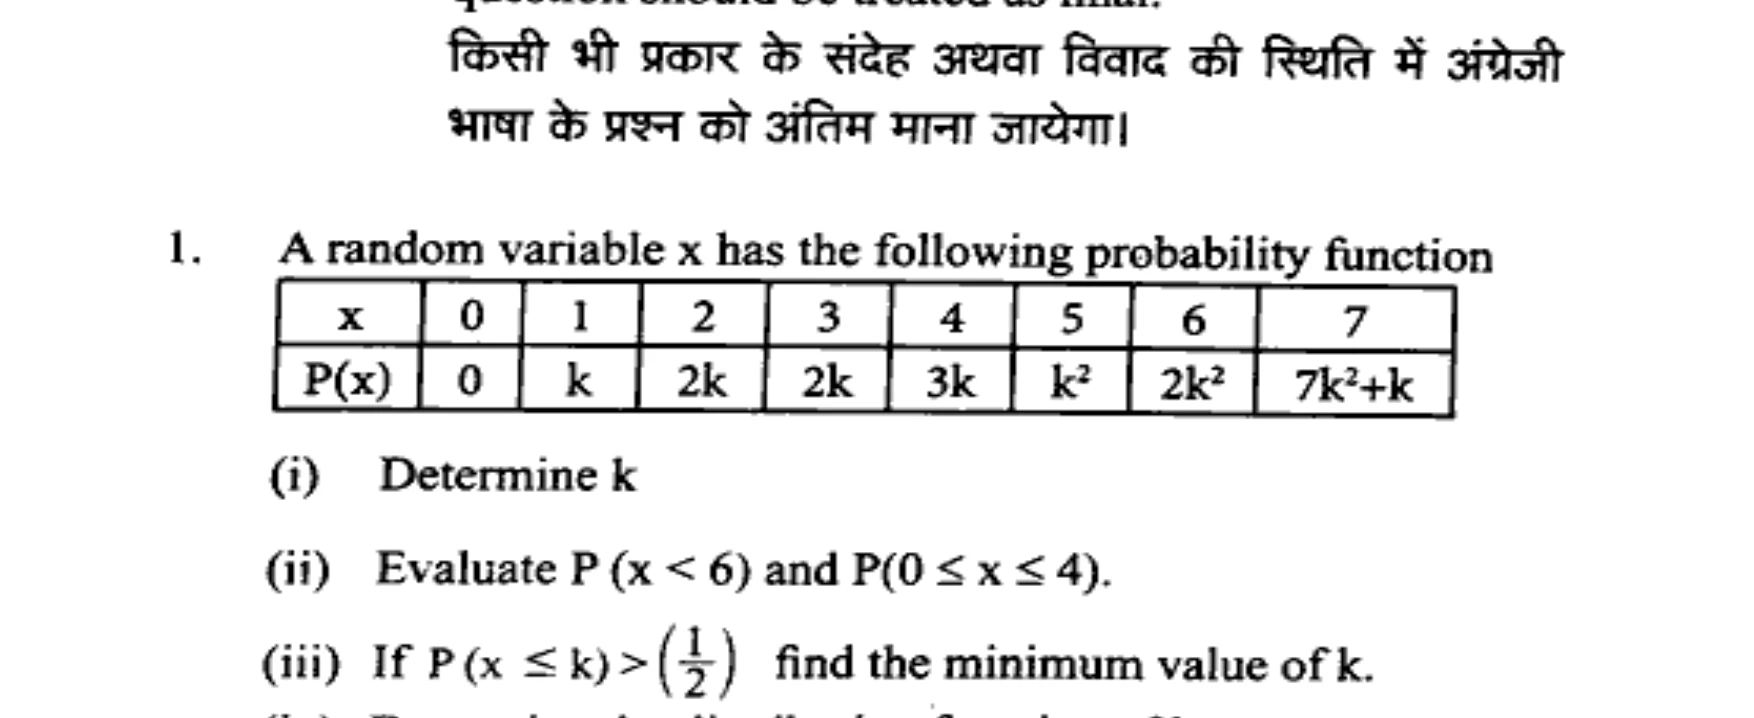
Determine k
Evaluate P(x < 6) and P(0 ≤ x ≤ 4).
If P(x ≤ k) > \( \frac{1}{2} \), find the minimum value of k.
Determine the distribution function of k.
Mean
(a) The density function of a random variable X is f(x)=e⁻ˣ when x ≥ 0. Find E(X), E(X²) and variance of X.
यादृच्छिक चर X का घनत्व फलन f(x)=e⁻ˣ है जब x ≥ 0 हो। X का E(X), E(X²) और प्रसरण ज्ञात कीजिए।
(b) Suppose a continuous random variable X has the probability density function f(x) = k(1-x²) for 0 < x < 1, and f(x)=0 otherwise.
Find (i) k (ii) Mean (iii) Variance.
मान लीजिए कि एक सतत यादृच्छिक चर X का प्रायिकता घनत्व फलन f(x)= k(1-x²) है, जहाँ 0 < x < 1, है, और अन्यथा f(x)=0 है।
(i) k ज्ञात कीजिए (ii) माध्य ज्ञात कीजिए (iii) प्रसरण ज्ञात कीजिए।
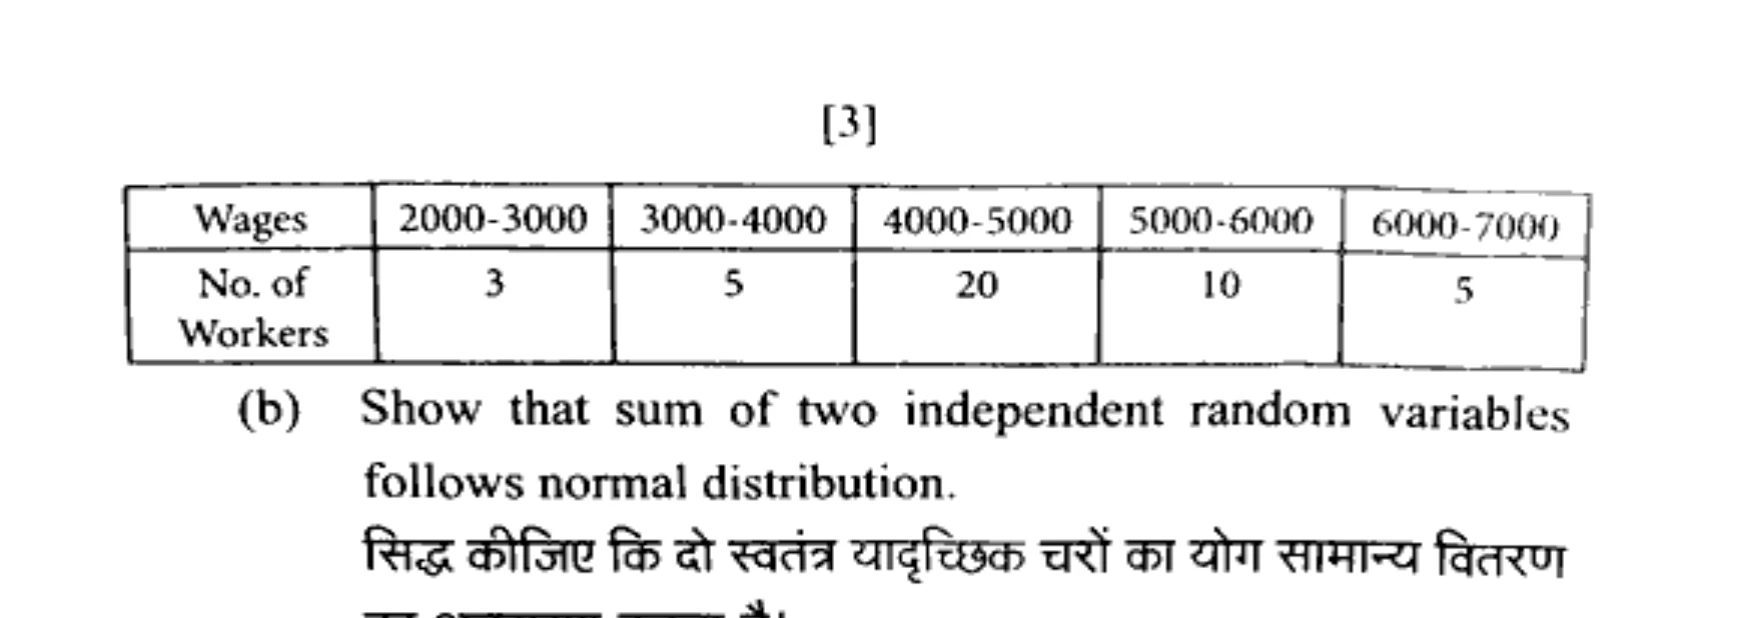
(a) Write down merits and demerits of measure of central tendency. Find the median for the following data:
केन्द्रीय प्रवृत्ति के माप के गुण-दोष लिखिए। निम्नलिखित आंकड़ों के लिए माध्यिका ज्ञात कीजिए:
(b) Define Exponential distribution with parameter θ and obtain its mean, variance and moment generating function.
θ पैरामीटर के साथ घातीय वितरण को परिभाषित करें और इसका माध्य, प्रसरण और क्षण उत्पन्न करने वाला फलन प्राप्त करें।
(a) State Chebyshev's inequality. If n → ∞, p →0 and np=λ, then show that binomial distribution reduces to Poisson distribution.
चे��ीशेव असमानता बताइए। यदि n → ∞, p →0 और np=λ, तो दिखाइए कि द्विपद वितरण पॉइसन वितरण में परिवर्तित हो जाता है।
(b) Define regression coefficient with its properties. If X ~ N (μσ²), then show that M_t(t) = e^(μt + (1/2)σ²t²).
प्रतिगमन गुणांक को उसके गुणों सहित परिभाषित करें। यदि X ~ N (μσ²), तो सिद्ध करें कि M_t(t) = e^(μt + (1/2)σ²t²).
(a) Fit a second degree parabola to the following data:
निम्नलिखित डेटा पर दूसरे डिग्री का परवलय फिट करें :
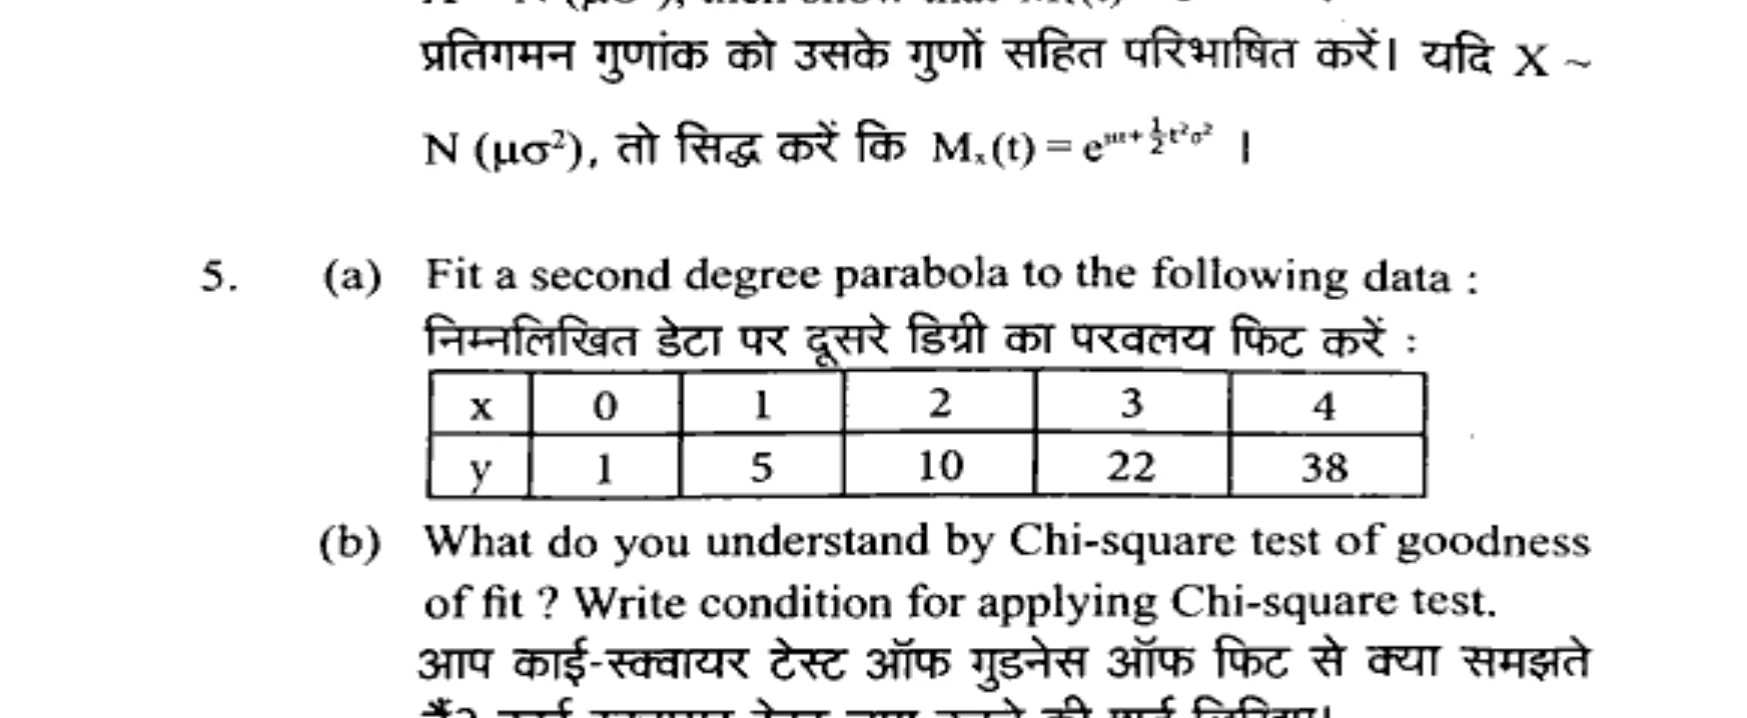
(b) What do understand by Chi-square test of goodness of fit ? Write condition for applying Chi-Square test.
आप काई-स्क्वायर टेस्ट ऑफ गुड़नेस ऑफ फिट स�� क्या समझते हैं? काई-स्क्वायर टेस्ट लागू करने की शर्तें लिखिए।
(a) Define Binomial distribution and obtain its mean and variance.
पद वितरण को परिभाषित करें और इसका माध्य और प्रसरण ज्ञात करें।
(b) Define Exponential distribution with parameter θ and obtain its mean, variance and moment generating function.
θ पैरामीटर के साथ घातीय वितरण को परिभाषित करें और इ��का माध्य, प्रसरण और क्षण उत्पन्न करने वाला फलन प्राप्त करें।
(a) Average number of accidents on any day on a national highway is 1.6. Determine the probability that the number of accidents are
at least one (ii) at most one.
किसी राष्ट्रीय राजमार्ग पर किसी भी दिन होने वाली दुर्घटनाओं की औसत संख्या 1.6 है। दुर्घटनाओं की संख्या की प���रायिकता ज्ञात कीजिए:
(i) कम से कम एक (ii) अधिकतम एक।
(b) Define correlation. Explain types of correlation and method of studying correlation.
सहसंबंध को परिभाषित कीजिए। सहसंबंध के प्रकार और सहसंबंध के अध्ययन की विधि को समझाइए।
(a) Find Karl Pearson's coefficient of correlation from the following data -
निम्नलिखित आंकड़ों से कार्ल पियर्सन का सहसंबंध गुणांक ज्ञात कीजिए-
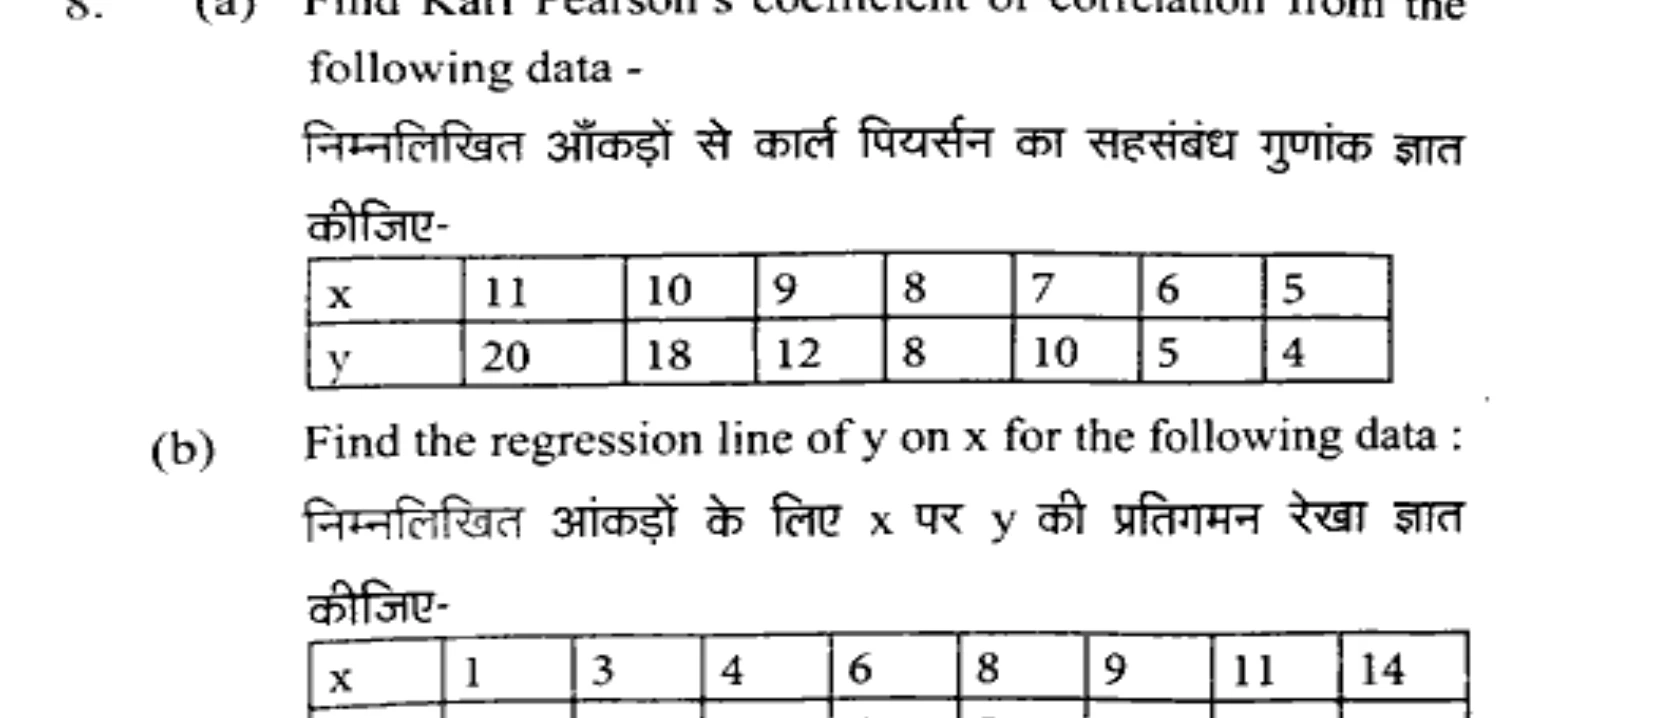
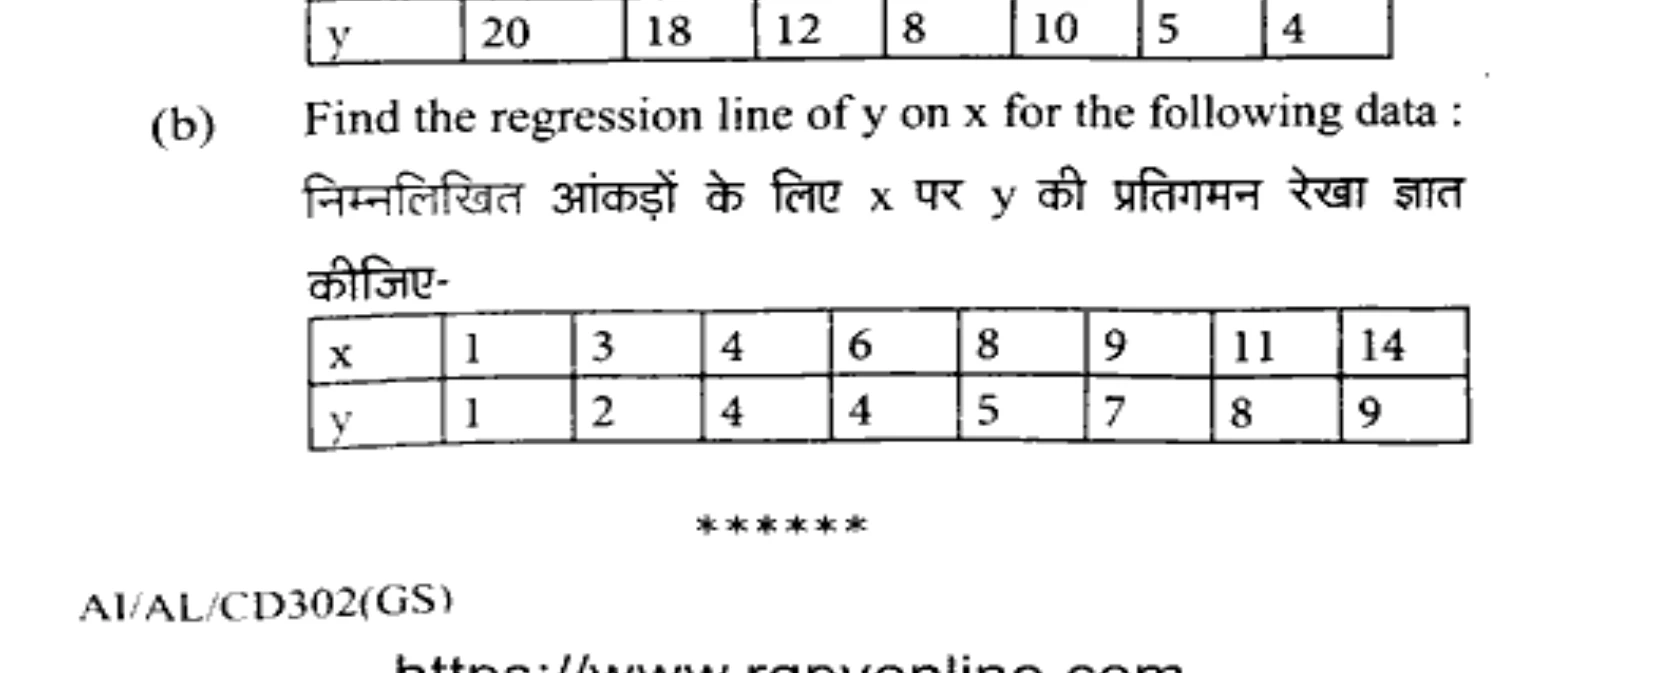
(b) Find the regression line on y on x for the following data:
निम्नलिखित आंकड़ों के लिए x पर y की प्रतिगमन रेखा ज्ञात कीजिए: