Save as PDF
Opens your browser print dialog — select "Save as PDF" to download.
AD-302 (GS)
B.Tech., III Semester
Examination, December 2023
Grading System (GS)
Probability and Statistics for Data Science
Note: i) Answer any five questions.
ii) All questions carry equal marks.
सभी प्रश्नों के समान अंक हैं।
iii) In case of any doubt or dispute the English version
shall be treated as final.
किसी भी प्रकार के संदेह अथवा विवाद की स्थिति में अंग्रेजी भाषा
के प्रश्न को अंतिम माना जायेगा।
a) Calculate the mean and standard deviation for the
following table given the age distribution of 542 members.
542 सदस्यों के आयु वितरण को देखते हुए निम्न तालिका के लिए
माध्य और मानक विचलन की गणना करें।

b) The first of the two samples has 100 items with mean
15 and standard deviation 3. If the whole group has
250 items with mean 15.6 and standard deviation √13.44,
find the standard deviation of the second group.
दो नमूनो से से पहले में माध्य 15 और मानक विचलन 3 के साथ
100 आइटम है। यदि पूरे समूह में माध्य 15.6 और मानक विचलन
√13.44 के साथ 250 आइटम है, तो दूसरे समूह का मानक
विचलन ज्ञात करें।
The first four moments of the distribution about the value for
4 of the variable are -1.5, 17, -30 and 108. find the moments
about mean β1 and β2.
चर के 4 के मान के बारे में बंटन के पहले चार आपूर्णां हैं -1.5, 17,
-30 और 108. माध्य β1 तथा β2 ज्ञात कीजिए।
a) A continuous random variable X has a p.d.f.
एक सतत यादृच्छिक चर X का एक p.d.f. है।
f(x) = 3x2, 0 ≤ x ≤ 1. Find a and b such that
f(x) = 3x2, 0 ≤ x ≤ 1. Find a and b such that
i) P (X < a) = P (X > a),
i) P (X < a) = P (X > a),
ii) P (X > b) = 0.05.
ii) P (X > b) = 0.05.
b) Ten coins are thrown simultaneously. Find the probability
of getting at least seven heads.
दस सिक्के एक साथ फेके जाते हैं। कम से कम सात चित्त आने की
प्रायिकता ज्ञात कीजिए।
a) Fit a straight line to the following data:
निम्नलिखित डाटा के लिए एक सीधी रेखा उपयुक्त करें।
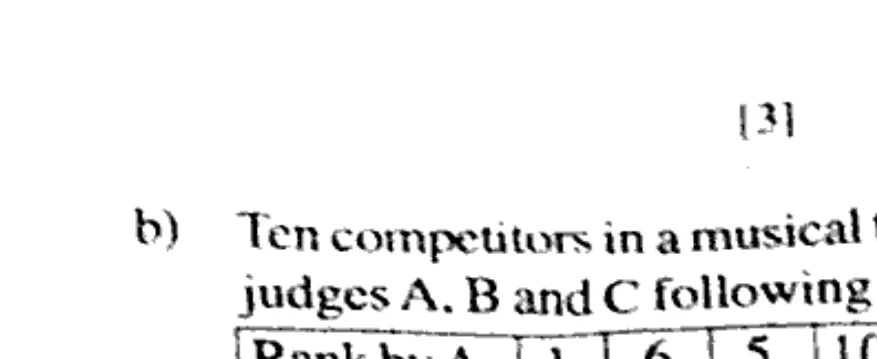
b) Ten competitors in a musical test were ranked by the three
judges A, B and C following order.
एक संगीत परीक्षा में दस प्र���ियोगियों को तीन न्यायाधीशों A, B और
C ने निम्नलिखित क्रम में स्थान दिया।

Using Rank Correlation method, discuss which pair of
judges has the nearest approach to common likings in
music.
रैंक सहसंबंध पद्धति का उपयोग करते हुए, चर्चा करें कि जजों की
कौन-सी जोड़ी संगीत में आम पसंद के निकटतम दृष्टिकोण रखती है।
a) Variable X and Y have the joint p.d.f.
f(x,y) = (1/3)(x+y), 0 ≤ x ≤ 1, 0 ≤ y ≤ 2
चिर X और Y का संयुक्त p.d.f
f(x,y) = (1/3)(x+y), 0 ≤ x ≤ 1, 0 ≤ y ≤ 2
Find:
खोजें।
i) r(X,Y)
i) r(X,Y)
ii) The two lines of regression
ii) प्रतिगमन की दो पंलियां
iii) The two regression curve for the means
iii) साधनों के लिए दो प्रतिगमन वक्र
a) Find the most likely price in Bombay corresponding to
the price of Rs. 70 at Calcutta from the following:
निम्नलिखित डेटा के अनुसार कलकत्ता में रुपये 70 की कीमत के लिए
बॉम्बे में सबसे संभावित कीमत ज्ञात कीजिए:
b) Test the hypothesis data σ = 10 given data s = 15 for a
random sample of the size 50 from a normal population.
परिकल्पना डाटा का परीक्षण करें σ = 10 दिया गया डाटा s = 15 एक
सामान्य आबादी से आकार 50 के एक यादृच्छिक नमूने के लिए।
c) The height of 10 males of a given locality are found to be
70, 67, 62, 68, 61, 68, 70, 64, 64, 60 inches. Is it
responsible to believe that the average height is greater
than 64 inches? Test at 5% significant level, assuming
that for 9 degree of freedom P(t > 1.83) = 0.05.
किसी दिए गए इलाके के 10 पुरुषों की ऊंचाई 70, 67, 62, 68, 61,
68, 70, 64, 64, 60 इंच पाई जाती है। क्या यह मानने के लिए
जिम्मेदार है कि औसत ऊंचाई 64 इंच से अधिक है? 5% महत्वपूर्ण
स्तर पर परीक्षण करें, यह मानते हुए कि स्वतंत्रता की 9 डिग्री के लिए
P(t > 1.83) = 0.05.
a) The contents of urns I, II and III are as follows:
I: 2 white, 3 black and 3 red balls
II: 2 white, 1 black and 1 red ball
III: 4 white, 5 black and 3 red balls
one urn is chosen at random and two balls drawn. They
happens to be white and red. What is the probability that
they come from urns I, II and III ?
एक कलश यादृच्छिक रूप से चुना जाता है और दो गेंदें निकाली जाती
हैं। वे सफेद और लाल होती हैं। क्या संभावना है कि वे कलश I, II और
III से आती हैं?
b) Six coins are tossed 6,400 times. Using the Poisson
distribution, find the approximate probability of getting
six heads r times.
छह सिक्कों को 6,400 बार उछाला जाता है। पायसों बंटन का प्रयोग
करते हुए, छः चित्त r बार आने की सन्निकट प्रायिकता ज्ञात कीजिए।
a) Prove that for the normal distribution, the quartile
derivation, the mean deviation and standard deviation are
approximately 10:12:15.
सिद्ध कीजिए कि सामान्य बंटन के लिए चतुर्थक व्युत्पत्ति, माध्य
विचलन और मानक विचलन लगभग 10:12:15 हैं।
b) By the method of least squares fit a parabola of the form
y = a + bx + cx2 for the following data.
कम से कम वर्गों की विधि से निम्नलिखित आँकड़ों के लिए
y = a + bx + cx2 के रूप में एक परवलय समंजित कीजिए।